Trial 215.01: Efficacy of Turval B0399 on the growth and conversion index of broiler chicken
(Trial conducted at the client's farm, M-Feed - Vojvodina, Serbia)
Ana Backović1, PhD; Mladen Savić2; Mauro Poian3
1. Post-doc at ICGEB, Trieste, Italy
2. Biologist / Microbiologist at M-Feed, Doo, Serbia
3. Statistician; Co Founder at Plus srl
The test was conducted at the experimental farm of M-Feed, Doo, on a total of 24180 broiler chicken. A study was conducted to evaluate the effect of supplemental yeast culture (Kluyveromyces marxianus fragilis B0399, commercially: Turval B0399) in broiler diets on weight gain and cumulative growth performance and finally the effect of the treatment on the economics of fattening and gross profit margin.
One-day-old Ross 308 chicks (n = 12090) were randomly assigned to 1 of 2 dietary treatments based on a commercial Starter Feed accompanied with 1.1 kg of yeast culture, suspended in 1000l of drinking water for 21st days of life, followed by the dietary switch to Grover Feed accompanied with 260gr of yeast culture, suspended in 1000l of drinking water and this Grower phase treatment lasted for additional 14 days.
Other half of the chicks (n = 12090) was randomly assigned to the control treatment. The control sample received the same commercial feed compound and drinking water without yeast additive.
Chicks were fed according to the technological standards and the feed assigned to each compartment was registered every day. Growth performance was monitored in the following way: 200 chicks were randomly taken for weight measuring from both study groups on the day one, and the following measures were taken in the same way every two days during the first week of the treatment and then every day till the end of the trial. The final individual weight was 8.5 % higher in the yeast - treated group comparing to the control group and the average feed conversion index was significantly reduced by 8.6%(P=0.0491) comparing to the control group. With the supplementation with Turval B0399 feed was better converted to growth and on the whole the results clearly demonstrate that the additive Turval B0399 at the suggested dosage improved growth performance of the broiler chicken.
In addition, group receiving the yeast additive showed mortality decreased by 4.7 % at the end of the trial.
Effects of Turval B0399 in the diet of the broiler chicken:
-growth performance during Starter and Grower phase,
-conversion index
-mortality
-medication treatment
The test was conducted at the experimental farm of M-Feed, Doo, Serbia, on a total of 24180 broiler chicken. The subjects (Ross 308 chicks) were randomly assigned to two big sheds that can operate as two large floor pens to demonstrate commercial poultry meat production.
The trial lasted 35 days. Chicks were fed according to the technological standards and the feed assigned to each compartment was registered every day. Growth performance was monitored in the following way: 200 chicks were randomly taken for weight measuring from both study groups on the day one, and the following measures were taken in the same way every two days during the first week of the treatment and then every day till the end of the trial.
Groups tested and statistical aspects.
The sampling size is large enough to be representative of each population for the statistical data presented in the Results section.
Characteristics of the feed
Starter Feed Type, produced by LIRA MIX IRIG, Serbia: 22% of total proteins
Grower Feed Type, produced by LIRA MIX IRIG, Serbia: 19% of total proteins
Chicks were fed according to the technological standards and the feed assigned to each compartment was registered every day.
Characteristics of the additive and its dosage:
TURVAL B0399 -Dried concentrated yeast Kluyveromyces m. B0399 – Raw material for
fodders-zootechnical use in powder form.
Batch No: T0433NB
Manufacturing date: Nov-2014
Expiry date: Nov-2016
The additive was suspension in adequate amount of drinking water each day, by means of Nipple watering system in the following way:
- during the starter phase (from day1 to day 21): 1.1 kg of yeast culture in 1000l of drinking water
- during the grower phase (from day 22 till day 35): 260 gr of yeast in 1000l of drinking water
Experimental facilities utilized and pharm management
During the study chickens were settled in two big sheds that can operate as two large floor pens to satisfy commercial poultry meat production according to the technological standards. Environmental-controlled rooms (for lighting and temperature) and a partitioned caged-laying facility allow comparative evaluation of growth performance in two study groups.
Light program ("lights off") allows chickens to rest and results in better feed conversion. Light program starts from day 10 and consists od brief period of 2 hours of "lights off" and than it gradually increases to 8 hours later followed by revers gradual returning to 2 hours while getting closer to the end of the trial.
-Feed Mixing Unit and Feeding system
Facilities for on-farm mixing of experimental feeds include a new vertical/horizontal mixer, a number of smaller mixers, and a pelleter. Feeding is out of the bags that are unloaded in filling hoppers which are located at the beginning of each feeding line.
-Nipple watering system is used to provide sufficient water for optimum bird growth and efficiency.
Disease Management
State of health of the animals at the beginning of the experiment: good; Salmonella negative on the beginning of the trial.
In the management of poultry farms, probably one of the most difficult phases is the
management of the newly introduced flock. Immediately upon arrival the small chickens were vaccinated with two vaccines against infectious bronchitis. Gumboro - Live vaccine (freeze-dried) for poultry against Infectious Bursal Disease is administered on the 14th day via drinking water. Duck Plague Virus (DPV) Vaccine is given on the day 7 and day 21 according to the program of Veterinary Institute.
The presence of salmonella in fecal samples is diagnosed on day 30 days at the Veterinajry Institute of Belgrade.
Statistical analysis of the data:
The data for each group (considered as an experimental unit) were converted to individual data,
depending on the number of subjects per experimental unit on each day of the trial period.
Experimental unit for feed consumption is the effective number of subjects per group on the exact day during the trial period (effective group size) = input number of chicken per group decreased for the cumulative mortality until that day.
Experimental unit for body weight is 200 chicken randomly selected from each study group for measurements during the trial (in total, 30 measurements were done during the trial on the dates indicated in the Table1.).
Individual daily conversion index and individual daily weight increment were statistically compared between control and treated group at the end of the trial period. Individual body weight was also compared between the groups, both as averages/MEAN values for the whole trial period, and as the output values at the end of the trial. For statistical analysis all data are presented as MEAN, the standard deviation (SD) of the individual values and ± standard error of the mean (s.e.m.).
Thus, to evaluate whether a significant difference exists between conversion index and weight increment between the two groups, mean values, without the importance of the direction of the difference, we used the unpaired, two-tailed Student’s test.
Statistical analysis was carried out using "R language Software" (www.r-project.org). A value of P < 0.05 was considered significant.
Growth Performance
Feed consumption and mortality were monitored every day during the trial period, while body weights were measured every 2 days during the first week of the trial (days 1,3,5,7) and then every single starting from the day 9 till the day 33 and final output measurement was taken on the day 35 (Table.1).

Individual daily feed consumption
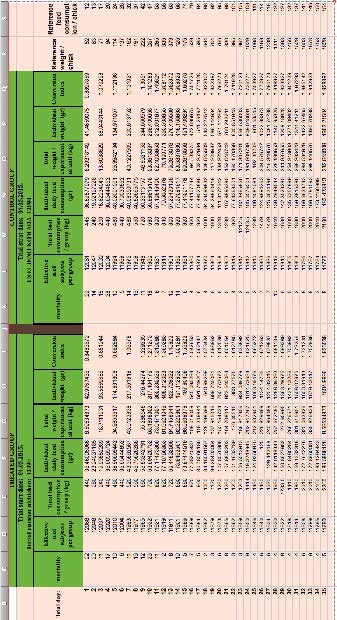
Individual daily feed consumption (Table1, columns F and N) were calculated on the bases of the feed given to two study groups each day of the trial and individual values are calculated by dividing total daily feed consumption of each group with the effective group size along the trial. The MEAN values between treated and control group sequentially are 94.66 vs 91.66 +/- 95% and they are not statistically significant (p=0.791) - Statistical table1, Histogram

Individual body weights and daily weight increment
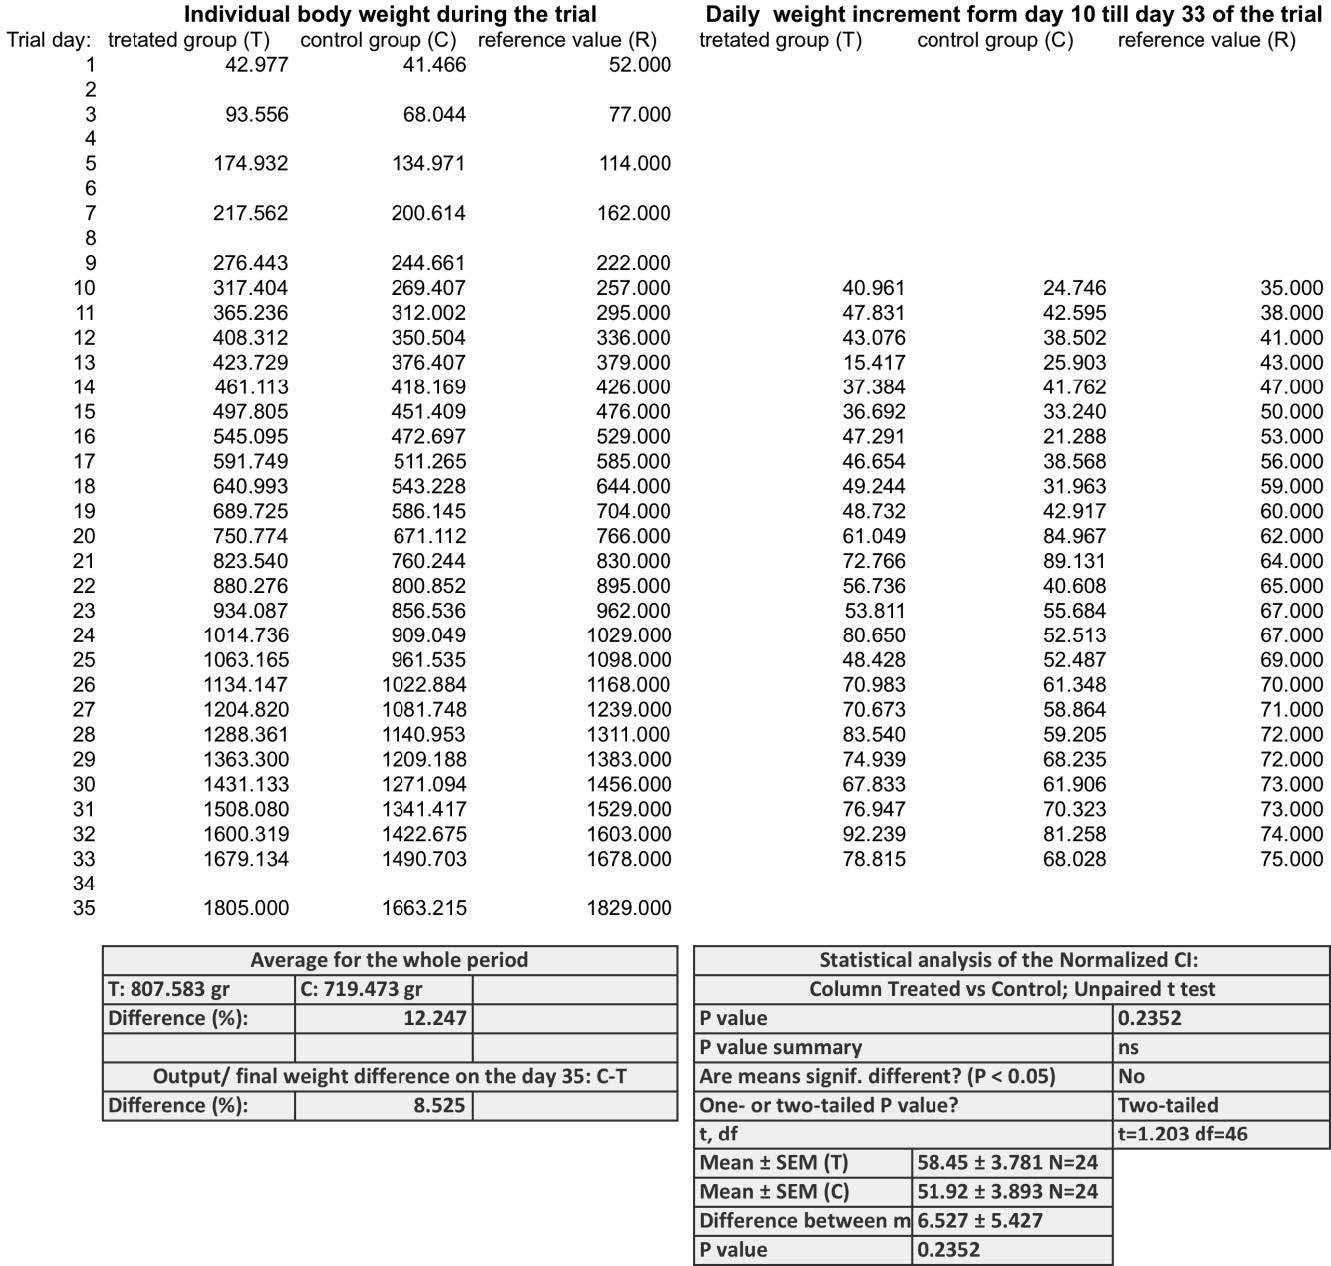
As shown in the Table 2, after 35 days of the trial the treated chicken in average weighted 8.5% more than the control chick, while the average weight for the whole trial period was 12.2% higher in the treated group than in the control group (807.5833823 vs. 719.4730664 gr. : +/- 95%). As shown in the chart 1a the growth curve of the treated group is also more similar to the reference one (reference values were taken from the Ross 308 Commercial Management Guide). Since samples were not weighted every day of the trial only consecutive day measurements were taken for statistical comparison of Individual daily weight increment (from day 10 till day 33). However this period covers the most part of the trial period and can represent the whole trial. As shown in the Table 2, the difference between average, daily feed increment is 6.5gr (12.5% +/- 5%) in favour of Turval B0399 treated group but this difference is not statistically significant (p=0.235 in Table2). However chart 1b shows that the oscillations of average daily weight increment values around reference values, for the indicated trial period (day 10-day33), are smaller and better positioned around reference values for the treated group than for the control group


Individual (feed to weight) conversion index
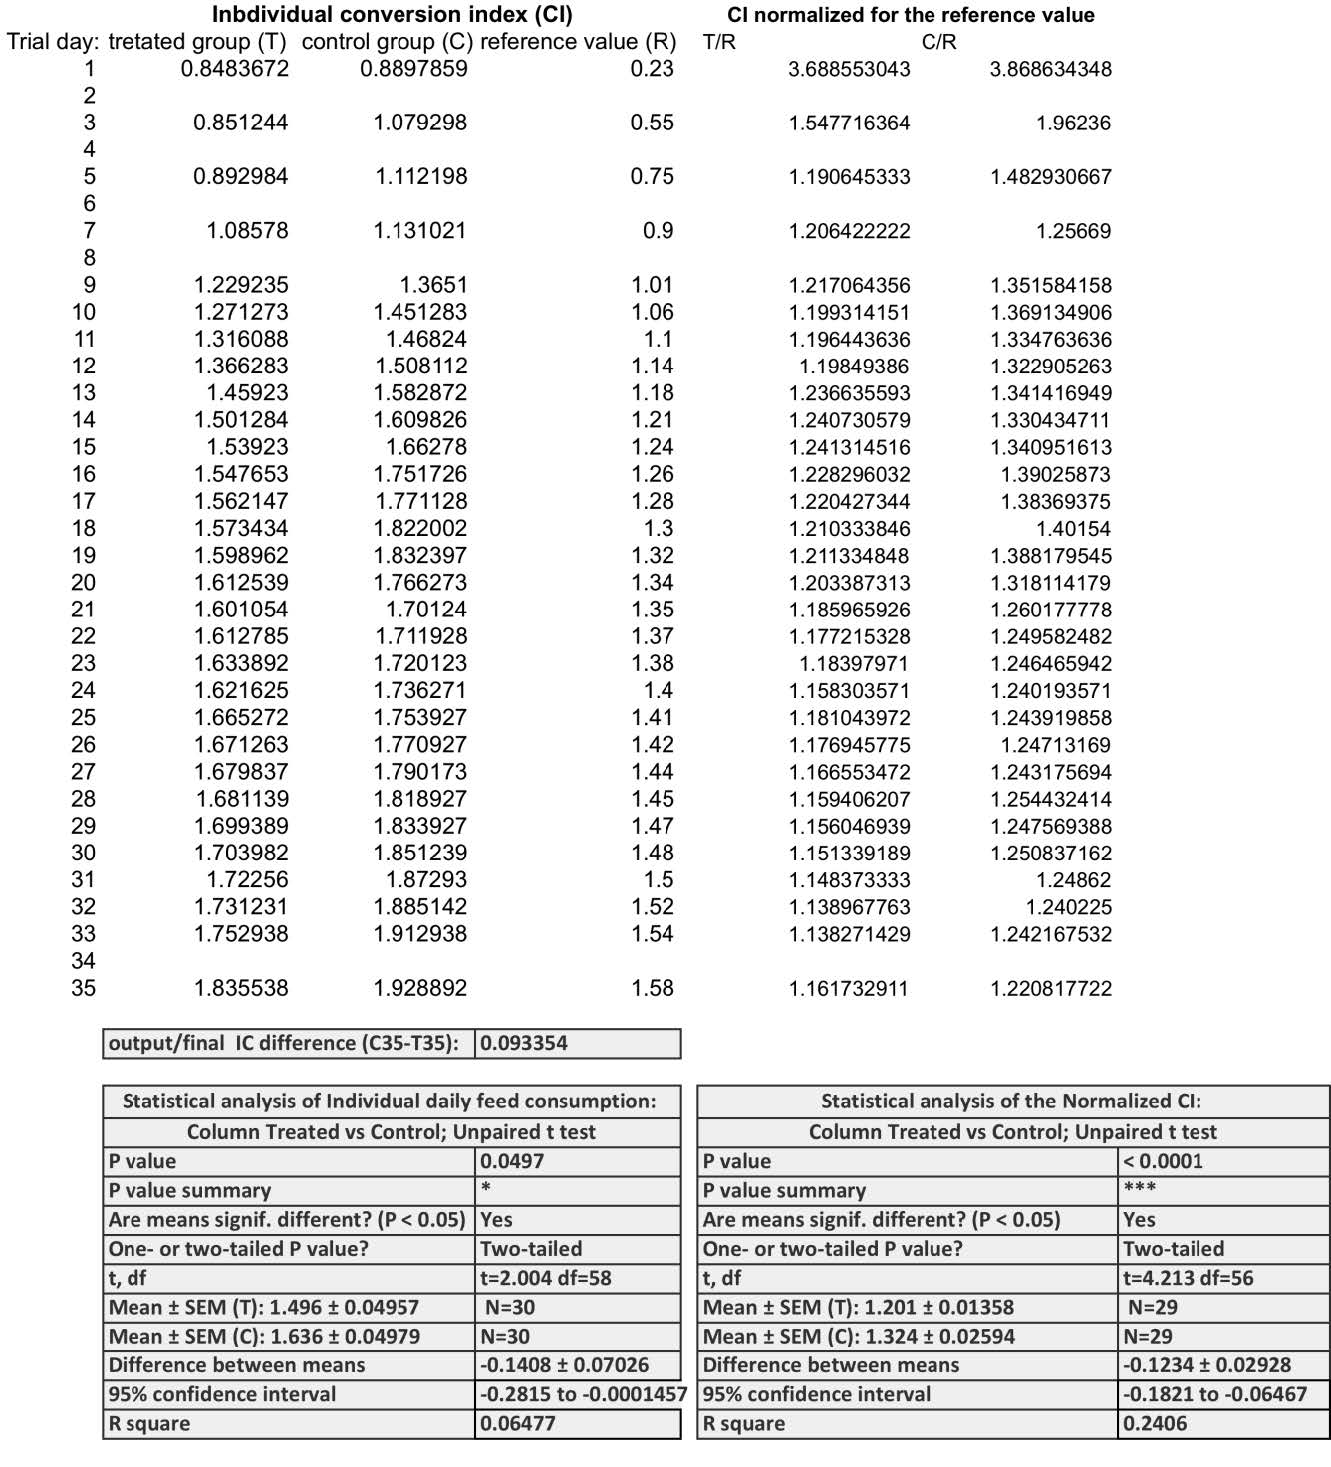
Individual conversion index was calculated for the trial days when sample chickens were weighted - Table 3a. These values represent the ratio between the total feed consumed until a certain day of the trial and weight of the chick on that day.
Statistical analysis (in the bottom of the Table3a) shows that the MEAN values of conversion index for the treaded and control group successively are: 1.496 vs. 1.636 ± 95% confidential interval and that the difference between the means is statistically significant (p=0.0497) (Histogram2a). That these two populations are completely separated we can clearly see in the Chart2a.


However, conversion index has the intrinsic increasing directionality / trend which can be eliminated by normalization of the individual values of control and treated group with the ones from the referent values (column R in Table 3a). These normalized values are more suitable for comparison by Student t-test whose results showed very strong statistical significance of the clear difference between the two populations p < 0.0001 (bottom part of the Table 3b) - Chart 2b, Histogram 2b. (note: normalized CI on the day 1 was eliminated from the chart and from statistical analysis as an outlier)

Finally, according to the M-Feed pharm manager the most meaningful value from the economical aspect is the output conversion index obtained at the end of the trial period, which are 1.83 vs 1.93 +/- 95% for Turval treated vs. control group.
Medication treatment
Vaccines against infectious bronchitis, Gumboro - Live vaccine and Duck Plague Virus (DPV) Vaccine, vitamins and antibiotics were give in the same dosage in both treated and control group.